On the train back from the office, somewhere between a coffee and the next station, a question popped into my head:
Can we trust the demographic report in the Google Ads dashboard?
It’s the kind of question most media buyers quietly ignore. We make budget decisions, audience exclusions, and creative calls based on those age bands every week — but how often do we actually check whether they’re true?
The lazy (and fastest) way to find out
I asked Claude, which is connected to our CRM tools, to pull last year’s lead data and group it by age band.
Less than a minute later, I had the table.
This is the part that still feels surreal. When your AI agent is wired into the tools you already use — the CRM, the ad platform, the spreadsheet — analysis becomes almost conversational. No exports, no CSV wrangling, no “can you send me the file?” It’s a genuinely seamless experience. Especially when you’re not paying for the tokens. 😌
From table to chart
With the CRM breakdown in hand, I added a second column for the Google Ads data, then threw it into a quick visualisation so the whole thing was easy to digest.
Here’s what came out:
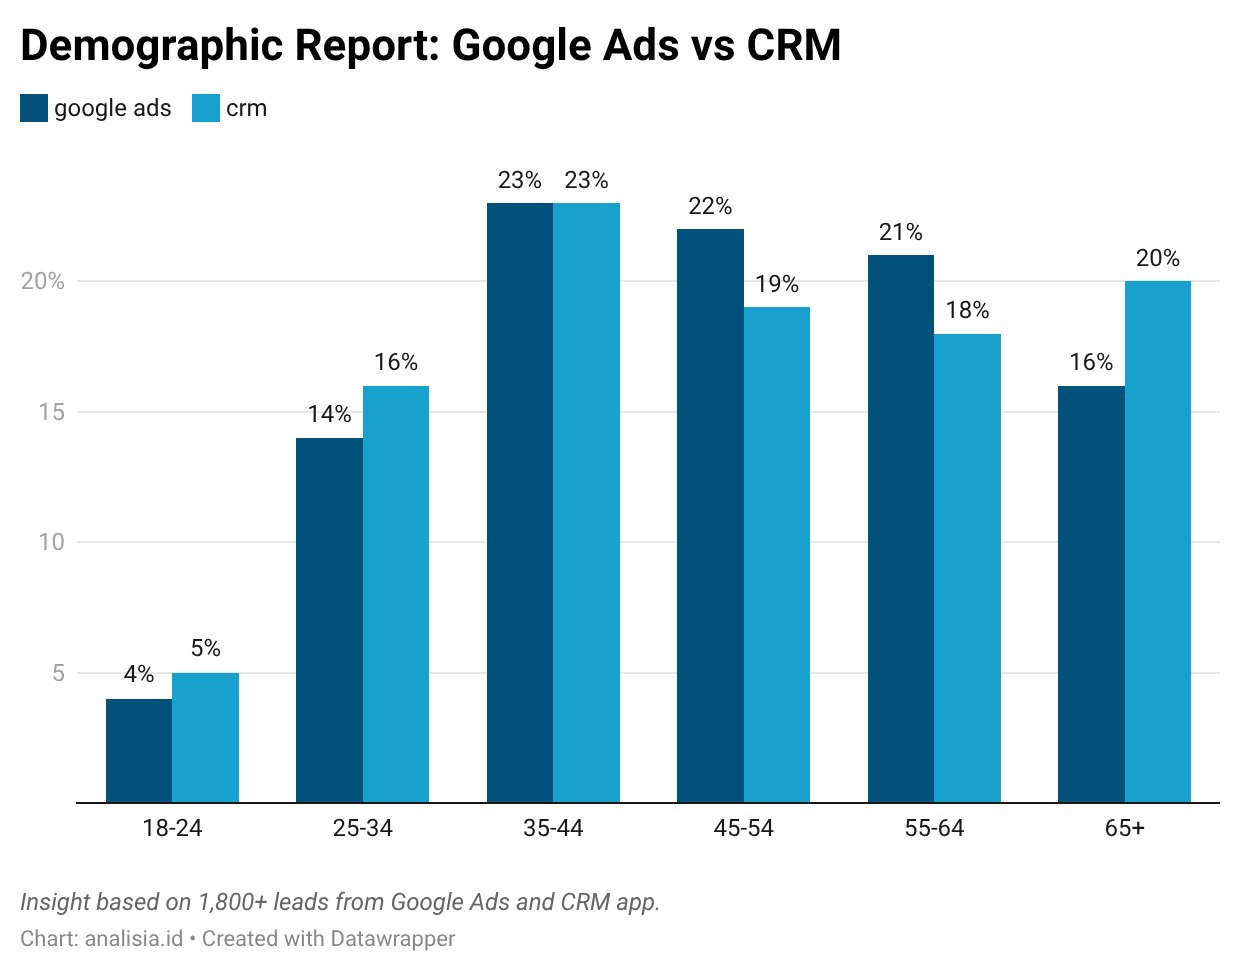
Chart: analisia.id • Created with Datawrapper
| Age band | Google Ads | CRM |
|---|---|---|
| 18–24 | 4% | 5% |
| 25–34 | 14% | 16% |
| 35–44 | 23% | 23% |
| 45–54 | 22% | 19% |
| 55–64 | 21% | 18% |
| 65+ | 16% | 20% |
The verdict: yes, you can trust it
Look at the two series. They track each other closely. The 35–44 band — the single biggest cohort for both — is an exact match at 23%. The rest of the distribution follows the same shape, with only small gaps at the edges.
If Google Ads demographic reporting were wildly inaccurate, we’d expect the two lines to diverge. They don’t. We can trust the demographic report provided by Google Ads.
That’s a useful thing to be able to say. It means the age bands you see in the dashboard are good enough to plan and optimise against — you don’t need to second-guess every audience decision with a data pull.
The caveats (because there always are some)
Before anyone runs off and rebuilds their audience strategy on the back of one chart:
- One brand only. This is a single brand in the UK. Your mileage will vary by category, price point, and channel mix.
- 1,800+ leads analysed — roughly 1,900 conversions, drawn from both Google Ads and the CRM.
- Directional, not gospel. The numbers agree closely here, which is reassuring. But “trustworthy enough to act on” isn’t the same as “audit-grade precise.” If a budget decision hinges on a single age band, still sanity-check it against your own first-party data.
Why this matters
Demographic targeting is a lever. If the data behind it is sound, you can pull that lever with confidence. If it isn’t, you’re optimising against a fiction.
The good news from this little experiment: the lever is real. And the fact that a quick question on a train ride turned into a clean, decision-ready analysis in under a minute is, honestly, the more interesting story here.
The tooling is finally keeping up with the curiosity.
Get the weekly performance digest
Weekly marketing insights from the Analisia team, straight to your inbox.